Приёмы создания илюстраций в LATEX

Файлы и листинги которые я размещаю не идеальны, это рабочие файлы, которые делались часто на скорость.

Преамбула

В большинстве случаев я использую некий шаблон постоянного содержания откуда указывается путь к файлу с содержимым. Если надо задать некоторые функции я их выношу в отдельный файл, как впрочем настройки стилей, так и пакеты для использования.

  • Основной файл: prez.tex
  • Функции: functions.tex
  • Подключаемые пакеты: packages.tex
  • Настроки стилей: header.sty
  • Пример файла с содержимым: cont.tex
  • Все растровые картинки располагаются в директории ./fig
  • Файлы для графиков располагаются в директории ./plot

Для сборки всего в один pdf файл используется:
lualatex --shell-escape prez.tex

Примеры

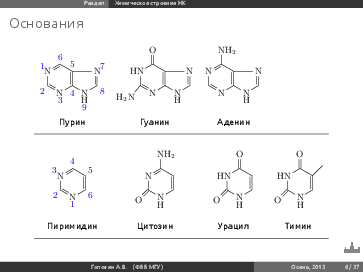
Химические формулы (chemfig):

Номера атомов располагались с помощью невидимых связей

Код Результат

\begin{frame}{Основания}
    \setatomsep{1.6em}%
      \footnotesize \begin{tabular}{c c c c}
          \chemfig{*6((-[5,0.5,,,draw=none]\color{blue}2)=N(-[6,0.5,,,draw=none]\color{blue}3)-
             (-[6,0.5,,,draw=none]\color{blue}4)*6(
            -\chembelow{N}{H}(-[6,1.0,,,draw=none]\color{blue}9)-
              (-[7,0.5,,,draw=none]\color{blue}8)=N?(-[1,0.5,,,draw=none]\color{blue}7))
              =?(-[2,0.5,,,draw=none]\color{blue}5)-(-[2,0.5,,,draw=none]\color{blue}6)
              =N(-[3,0.5,,,draw=none]\color{blue}1)-[,,1])} &

            \chemfig{*6((-[:-130]H_2N)=N-*6(-\chembelow{N}{H}-=N?)=?-(=[2]O)-HN-[,,2])}&
            \chemfig{*6(=N-*6(-\chembelow{N}{H}-=N?)=?-(-[2]NH_2)=N-[,,1])}&~\\[1.0cm]-HN-[,,2])}&
            \chemfig{*6(=N-*6(-\chembelow{N}{H}-=N?)=?-(-[2]NH_2)=N-[,,1])}&~\\[1.0cm]
            Пурин&Гуанин&Аденин& \\[.2cm]
             \hline\\[.2cm]
             \chemfig{*6((-[5,0.5,,,draw=none]\color{blue}2)=N(-[6,0.5,,,draw=none]\color{blue}1)
             -(-[7,0.5,,,draw=none]\color{blue}6)
             =(-[1,0.5,,,draw=none]\color{blue}5)-(-[2,0.5,,,draw=none]\color{blue}4)=N(
             -[3,0.6,,,draw=none]\color{blue}3)-)} &
            \chemfig{*6((=[5]O)-\chembelow{N}{H}-=-(-[2]NH_2)=N-)} &
            \chemfig{*6((=[5]O)-\chembelow{N}{H}-=-(=[2]O)-HN-[,,2])} &
            \chemfig{*6((=[5]O)-\chembelow{N}{H}-=(-[1])-(=[2]O)-HN-[,,2])} 
              \\[1.0cm]
            Пиримидин&Цитозин&Урацил&Тимин\\[.2cm]
             \hline

        \end{tabular}
        \end{center}
\end{frame}

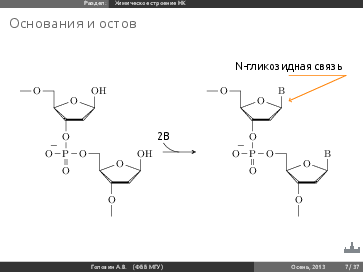
Стерео связи и подписи:

Код Результат

\begin{frame}{Основания и остов}
        \begin{center}
    \begin{tikzpicture}[help lines/.style={thin,draw=black!50}]
        \node (2) at (6,5) {N-гликозидная связь};
        \node (1) at (2,2) {%
    \schemestart[][west]
    \setatomsep{1.7em}\setcrambond{0.2em}{}{}%
     \small\chemfig{-[0]O-[0]-[6]?<[7](-[,,,,line
        width=0.2em]>[1](-[2]OH)-[:160,1.3]O?)-[6]O
        -[6]P(=[:-90]O)(-[4]\chemabove{O}{\hspace{1em}-})
        -[0]O-[0]-[6]?[c2]<[7](-[,,,,line
        width=0.2em]>[1](-[2]OH)-[:160,1.3]O?[c2])-[6]O-[6]
    }
    \arrow{-U>[ 2B ]}[0] 
    \setatomsep{1.7em}\setcrambond{0.2em}{}{}%
      \small\chemfig{-[0]O-[0]-[6]?<[7](-[,,,,line
        width=0.2em]>[1](-[2]B)-[:160,1.3]O?)-[6]O
        -[6]P(=[:-90]O)(-[4]\chemabove{O}{\hspace{1em}-})
        -[0]O-[0]-[6]?[c2]<[7](-[,,,,line
        width=0.2em]>[1](-[2]B)-[:160,1.3]O?[c2])-[6]O-[6]
    }
\schemestop};
\draw [orange,thick](2.south east) -- (2.south);
\draw [->,orange,thick] (2.south east) -- (6,3.8);
\end{tikzpicture}
        \end{center}
\end{frame}

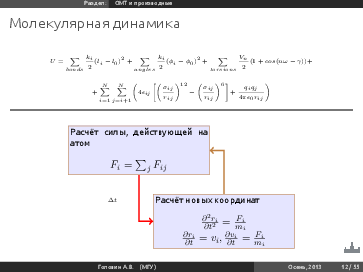
Формулы и объеткы tikz:

Код Результат

{Молекулярная динамика}
\begin{center}
    \tiny
$$ U=\sum_{bonds}{ \frac{k_i}{2} ( l_i - l_0)^2} + \sum_{angles}{ \frac{k_i}{2} ( \phi_i - \phi_0)^2} 
+ \sum_{torsions} { \frac{V_n}{2} (1 + cos(n\omega - \gamma))} + $$
$$ + \sum_{i=1}^N \sum_{j=i+1}^N  \left (   4 \epsilon_{ij} \left [ \left ( \frac{\sigma_{ij}}{r_{ij}} 
\right )^{12} - \left ( \frac{\sigma_{ij}}{r_{ij}} \right )^6  \right ] + 
\frac{q_i q_j}{ 4\pi \epsilon_0 r_{ij}} \right ) $$  
\rule[0.5cm]{\linewidth}{1pt}
\begin{tikzpicture}[node distance=1cm, auto]  
\tikzset{%
    mynode/.style={rectangle,draw=brown, top color=blue!10,bottom color=blue!10 },
    myarrow/.style={->, >=latex', shorten >=1pt, thick},
    mylabel/.style={text width=7em, text centered} 
}  
\node (nGray)   [mynode]   at      (0, 2.5) 
{%
    \begin{minipage}{0.4\textwidth}
        \footnotesize Расчёт силы, действующей на атом  
        \begin{center}
        \normalsize
$ F_i= \sum_j F_{ij} $
       \end{center}
    \end{minipage}
};
\node (nRed)    [mynode]    at      (3, 0)
{%
    \begin{minipage}{0.4\textwidth}
       \footnotesize Расчёт новых координат  
        \normalsize
        \begin{center}
            $ \frac{\partial^2r_i}{\partial t^2}=\frac{F_i}{m_i} $ \\
            $ \frac{\partial r_i}{\partial t} =v_i , \frac{\partial
            v_i}{\partial t} = \frac{F_i}{m_i} $
       \end{center}
    \end{minipage}
};
\node[mylabel, below of=nGray] (label1) at (-1,2) {%
    \begin{minipage}{0.1\textwidth}
           \[ \Delta t \]
    \end{minipage}
   };  
\draw [ color   = red,   ultra thick,  -> ](nGray) |- (nRed);
\draw [ color   = brown, ultra thick,  -> ](nRed) |- (nGray);
\end{tikzpicture} 
\end{center}
\end{frame}%

Формулы и функции:

Код Результат

\newcommand{\disk}[1]{%
   \begin{tikzpicture}\draw[fill=#1,overlay,#1](0,0)circle(2pt);\end{tikzpicture} 
}
newcommand{\gua}[2]{%
\setatomsep{2.0em}\setcrambond{0.2em}{}{}%
\chemfig{%
  -[:#2]\disk{blue}*5(-=@{n7#1}\disk{blue}-(*6(-(=@{o#1}\disk{red})-\disk{blue}(-@{n#1}\disk{gray})-(%
  -\disk{blue}(-[::60]\disk{gray})(-[::-60]@{n2#1}\disk{gray}))=\disk{blue}-))=-)%     
  }}
\begin{frame}%
{Квадруплексные ДНК}
        \begin{center}
  \begin{tikzpicture}[help lines/.style={thin,draw=black!50},
          every node/.style={scale=0.6}]
  %\draw[help lines] (0,0) grid (8,4);    
\node (2) at (6,1) {%
   % \schemedebug{true}
    \schemestart[][south west]
     \gua{1}{-72}
    \arrow[-24,0.05,draw=none]
     \gua{2}{-162}
    \arrow[-112.8,0.1,draw=none]
   % \hspace{-3cm}
     \gua{3}{-252}
    \arrow[-204,0.0,draw=none]
     \gua{4}{-342}
  \chemmove[dashed]{%
          \draw[shorten <=2pt,shorten >=2pt](o1) -- (n4);
          \draw[shorten <=2pt,shorten >=2pt](o2) -- (n1);
          \draw[shorten <=2pt,shorten >=2pt](o3) -- (n2);
          \draw[shorten <=2pt,shorten >=2pt](o4) -- (n3);
          \draw[shorten <=2pt,shorten >=2pt](n21) -- (n72);
          \draw[shorten <=2pt,shorten >=2pt](n22) -- (n73);
          \draw[shorten <=2pt,shorten >=2pt](n23) -- (n74);
          \draw[shorten <=2pt,shorten >=2pt](n24) -- (n71);
  }
     \schemestop    
     };
     \end{tikzpicture}
  \includegraphics[width=0.5\textwidth]{act2.png}
  \end{center}
\end{frame}%

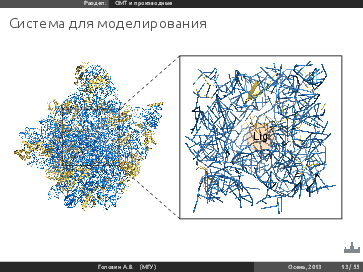
Изображение и объеткы tikz:

Код Результат

\begin{frame}%
{Система для моделирования}
\begin{tikzpicture}[xscale=1.0,yscale=1.0]
    \node (ri) at (3,2 ) {\includegraphics[width=0.45\textwidth]{ribo.png}};
    \node (cu) at (9,2) {\includegraphics[width=0.45\textwidth]{ribocube.png}};
    \draw[thick,opacity=0.7] (2,1) rectangle (4,3);
    \draw[thick] (cu.south west) rectangle (cu.north east);
    \draw[dashed] (4,3) -- (cu.north west);
    \draw[dashed] (4,1) -- (cu.south west);
      \begin{scope}[fill opacity=.5,transparency group]
    \node[thick,draw=black, fill=orange,opacity=0.5,circle,minimum size=1cm, radius=1.5] 
    at (cu.center) {~} ;
    \end{scope} 
     \node at (cu.center){Lig};
  \end{tikzpicture}
\end{frame}%

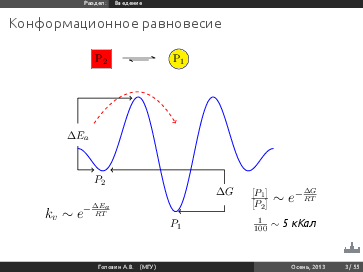
График функции и не только (pgfplot):

Код Результат

\begin{frame}%
{Конформационное равновесие}
  \begin{center}
    \schemestart 
    \setnodestyle{draw,rectangle,fill=red,minimum size=20pt}
    \chemfig{P_2} 
    \arrow{<->>}
    \setnodestyle{draw,circle,fill=yellow,minimum size=20pt}
    \chemfig{P_1}
    \schemestop
    \hspace{3cm}~\par
    \vspace{.75cm}
\begin{tikzpicture}[xscale=1.0,yscale=1.0]
    %% Pot energy plot
  \begin{axis}[height=7cm,width=15cm,
    xmin=-300,xmax=400,ymin=-.2, hide x axis, hide y axis,
    xlabel=$$, ylabel=$$]
   \addplot+[raw gnuplot, draw=blue, mark=none, smooth,thick] gnuplot[id=m]{%
         set xrange [-180:180]; plot 1-0.25*(1+cos(3*pi*x/180))- 0.25*(1+cos(2*pi*x/180)) };
  \draw[dashed,thick,red,->] (axis cs:-150,.7) parabola bend (axis cs:-70,0.95)(axis cs:0,.7);
  \addplot[->,thick] coordinates {(-180,0.33) (-150,0.33)};
  \addplot[->,thick] coordinates {(-180,0.90) (-80,.90)};
  \addplot[thick] coordinates {(-180,0.90) (-180,.70)};
  \addplot[thick] coordinates {(-180,0.33) (-180,.52)};
  \addplot[->,thick] coordinates {(90,0.33) (-120,0.33)};
  \addplot[->,thick] coordinates {(90,0.00) (5,.00)};
  \addplot[thick] coordinates {(90,0.33) (90,0.22)};
  \addplot[thick] coordinates {(90,0) (90,.05)};
  \node at (axis cs:-180,0.6) {$\Delta E_a$};
  \node at (axis cs:90,0.16) {$\Delta G$};
  \node at (axis cs:-140,0.25) {$P_2$};
  \node at (axis cs:0,-0.1) {$P_1$};
  \node at (axis cs:200,0.1){%
  \Large{$\frac{[P_1]}{[P_2]}\sim e^{-\frac{\Delta G}{RT}}
      $}
   } ;
  \node at (axis cs:200,-0.1){%
  $\frac{1}{100}\sim $ \textit{5 кКал}} ;
  \node at  (axis cs:-180,0){%
  \Large{$ k_v \sim e^{-\frac{\Delta E_a}{RT}}$}
  };
\end{axis}
\end{tikzpicture}
  \end{center}
\end{frame}%

Пример таблицы с указанием выравнивания текста (tabularx):

Код Результат

\newcolumntype{P}[1]{>{\raggedright\arraybackslash}p{#1}}
\newcolumntype{Z}[1]{>{\raggedleft\arraybackslash}p{#1}}
\newcolumntype{Y}[1]{>{\centering\arraybackslash}p{#1}}
\newcolumntype{M}{>{$\vcenter\bgroup\hbox\bgroup}c<{\egroup\egroup$}}

\begin{frame}%
\tiny\begin{tabularx}{\textwidth}{P{3cm} P{3cm} P{4.0cm} }
\hline
Система&Исследуемый фактор&Результат\\
\hline
Четырёх тяжевой  квадруплекс состоящий из  двух G-квартетов с катионом калия в
центре. & 
Влияние петель на стабильность G-стебля & G-стебль был стабилен в течении всех
700 наносекунд наблюдения \\
\hdashline
Четырёх тяжевой  квадруплекс состоящий из  двух G-квартетов без катиона в
центре\textsuperscript{*}  & Роль катиона в стабилизации G-стебля. &
G-стебель потерял структуру в начале наблюдения \\
\hdashline
ЯМР модель с заменой катиона калия на катион натрия.& Влияние параметров
описания катиона на поведение стабильной структуры 15-ТВА и её геометрию &
Не замечено значительной разницы в поведении структуры в комплексе с разными
катионами.\\
\hdashline
ЯМР модель без катиона внутри квадруплекса & Влияние стабилизирующего иона на
структурную стабильность 15-ТВА. & Несмотря на высокую амплитуду флуктуаций,
модель сохранила квадруплексную структуру. На 72 нс. катион натрия из раствора
проник в центр квадруплекса через ТТ петли  и стабилизировал молекулу до конца наблюдения.\\
\hdashline
ЯМР модель где основание Т9 ориентировано в раствор и не образует стэкинга с
верхним квартетом (TG(-T) ЯМР) & Способна ли ЯМР модель сохранить структуру если
только G8 из  TGT петли образует стэкинг с G-квадруплексом?& Аптамер потерял
структуру квадруплекса, все квартеты потеряли геометрию, не смотря на наличие
пары Т4-Т13 в стартовой структуре \\
\hdashline
РСА модель, где основание Т9 образует стэкинг с G-квартетом (ТG(+T) РСА)& Может
ли стекинг взаимодействие одного основания сделать РСА модель стабильной? &
Модель проявила гораздо лучшую стабильность и сохраняла квадруплексную структуру
в течении 790 нс., в этот момент основания Т4 и Т13 образовали стекинг
взаимодействие, которое привело к нарушению планарности нижнего квартета и
квдруплексная геометрия была потеряна\\
\hline
\end{tabularx}
\end{frame}%

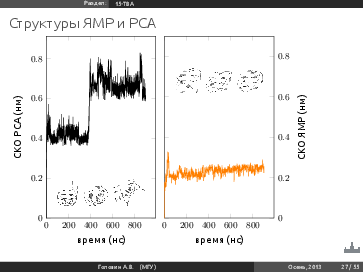
Пример c визуализацией данных и картинкой на графике (pgfplot):

Код Результат

\begin{frame}%
{Структуры ЯМР и РСА }
\begin{tikzpicture}
    \begin{axis}[
       xmin=0,ymin=0,     
       xlabel={время (нс)},
       ylabel={ СКО РСА (нм)},
       width=0.45\textwidth, height=8cm,
tick label style={font=\footnotesize},label style={font=\small}]
\addplot +[ color=black, mark=none] table [x expr=\thisrow{time}/1000,
y=rmsd]  {plots/pic5_data.dat};
\addplot graphics [xmin=100,xmax=900,ymin=0.05,ymax=0.2]{plots/pic5_bitmap.png};
%\node (1) at (axis cs:500, 0.6) {\includegraphics[width=0.6\pgfplotswidth]{plots/pic_5b_bitmap.png}};
    \end{axis}
\end{tikzpicture}
\begin{tikzpicture}
    \begin{axis}[
       xmin=0,ymin=0, ymax=0.9 , 
       xlabel={время (нс)},
       yticklabel pos=right,
       ylabel={ СКО ЯМР (нм)},
       width=0.45\textwidth, height=8cm,
tick label style={font=\footnotesize},label style={font=\small}]
\addplot+[no markers, raw gnuplot,color=orange]  gnuplot {%
set samples 1000;
plot "plots/nmrfftestrms.xvg" using ($1/1000):($2) smooth csplines with lines};
\addplot graphics [xmin=100,xmax=900,ymin=0.6,ymax=0.75]{pic_5b_bitmap.png};
%    \node (1) at (axis cs:500, 0.2) {\includegraphics[width=0.6\pgfplotswidth]{plots/pic5_bitmap.png}};
    \end{axis}
\end{tikzpicture}
\end{frame}%

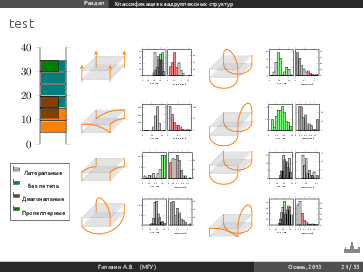
Рисование чего-то в tikz и циклы в latex:

Код Результат

\pgfplotsset{every axis legend/.append style={
     at={(0,-0.2)}, anchor=north}}
     \begin{tikzpicture}[baseline]
\begin{axis}[
     legend style={font=\tiny},      
    xbar,
    xmin=0,xmax=1, ymin=0,ymax=40,hide x axis, bar width=0.4cm,
     width=2.5cm, height=5cm
]
\addplot [draw=black,fill=orange] coordinates {(1,15.5) (1,20.5) };
\addlegendentry{Латеральные}
\addplot [draw=black,fill=green!50!blue] coordinates {(1,20) (1,25) (1,30) (1,35)};
\addlegendentry{Без петель}
\addplot [draw=black,fill=orange!50!black] coordinates {(.7,10) (.7,14.5) };
\addlegendentry{Диагональные}
\addplot [draw=black,fill=green!50!black] coordinates {(.7,24)};
\addlegendentry{Пропеллерные}
\end{axis}
\end{tikzpicture}
\tikzstyle{chain} = [thick,orange,>=stealth]
      \begin{tabular}{M M M M}
    \begin{tikzpicture}
    % stupido loopless parallel
      \coordinate (A) at (0,0); 
      \coordinate (B) at (1.0,0);
      \coordinate (C) at (1.5,.5);
      \coordinate (D) at (.5,.5);
      \draw[chain,->] ([yshift=-0.1cm]D) -- ([yshift=0.5cm]D);
      \begin{scope}[opacity=.5,transparency group]
      \foreach \i in {0cm,0.3cm} {
          \draw[fill=gray,opacity=0.5] 
          ([yshift=\i]A) -- ([yshift=\i]B) --
          ([yshift=\i]C) -- ([yshift=\i]D) -- cycle ;
  }
      \end{scope}
   \foreach \k in {A,B,C} {
      \draw[chain,->] ([yshift=-0.1cm]\k) -- ([yshift=0.5cm]\k);
  }
  \end{tikzpicture}%
           &
    \begin{tikzpicture}[every node/.style={scale=0.3},baseline]
    \begin{axis}[
       xmin=0,ymin=0.0, ybar, ybar, bar width=2pt,tiny,
       %ylabel={N, шт.},
       xlabel={угол, град},
       width=0.2\textwidth, height=2.5cm,]
       \addplot [no markers, raw gnuplot,fill=green!50!white]  table {%
        plots/acta/11.dist.twist};
     \end{axis}
    \end{tikzpicture}%
    \begin{tikzpicture}[every node/.style={scale=0.3},baseline]
    \begin{axis}[
       yticklabel pos=right,
       xmin=0,ymin=0.0, ybar, ybar, bar width=2pt,tiny,
       %ylabel={N, шт.}, 
       xlabel={планарность,\AA},
       width=0.2\textwidth, height=2.5cm,]
       \addplot [no markers, raw gnuplot,color=black,fill=red!50!white]  table {%
        plots/acta/11.dist.plane};
     \end{axis}
    \end{tikzpicture}%
           &%
    \begin{tikzpicture}[every node/.style={scale=0.8},baseline]
    % Basket like diagonal-lateral
      \coordinate (A) at (0,0); \coordinate (B) at (1.0,0);
      \coordinate (C) at (1.5,.5); \coordinate (D) at (.5,.5);
      \draw[chain] ([yshift=-0cm]D) -- ([yshift=0.3cm]D);
      \draw[chain] (C) edge[bend left=90, min distance=.5cm] (D);
      \begin{scope}[opacity=.5,transparency group]
      \foreach \i in {0cm,0.3cm} {
          \draw[fill=gray,opacity=0.5] 
          ([yshift=\i]A) -- ([yshift=\i]B) --
          ([yshift=\i]C) -- ([yshift=\i]D) -- cycle ;
      }
      \end{scope}
     \foreach \k in {A,B,C} {
      \draw[chain] ([yshift=-0cm]\k) -- ([yshift=0.3cm]\k);
     }
     \draw[chain] ([yshift=0.3cm]B) edge[in=90,out=90, min distance=.5cm]
     ([yshift=0.3cm]D);
     \draw[chain] (A) edge[bend right=90, min distance=.5cm] (B);
    \end{tikzpicture}
    &
    \begin{tikzpicture}[every node/.style={scale=0.3},baseline]
    \begin{axis}[
       xmin=0,ymin=0.0, ybar, ybar, bar width=2pt,tiny,
       %ylabel={N, шт.},
       xlabel={угол, град},
       width=0.2\textwidth, height=2.5cm,]
       \addplot [no markers, raw gnuplot,fill=green!50!white]  table {%
        plots/acta/3.dist.twist};
     \end{axis}
    \end{tikzpicture}%
    \begin{tikzpicture}[every node/.style={scale=0.3},baseline]
    \begin{axis}[
       yticklabel pos=right,
       xmin=0,ymin=0.0, ybar, ybar, bar width=2pt,tiny,
       %ylabel={N, шт.}, 
       xlabel={планарность,\AA},
       width=0.2\textwidth, height=2.5cm,]
       \addplot [no markers, raw gnuplot,color=black,fill=red!50!white]  table {%
        plots/acta/3.dist.plane};
     \end{axis}
    \end{tikzpicture}%
  \\
    \begin{tikzpicture} 
    % propellers
      \coordinate (A) at (0,0); 
      \coordinate (B) at (1.0,0);
      \coordinate (C) at (1.5,.5);
      \coordinate (D) at (.5,.5);
      %%%% chains below 
      \draw[chain] ([yshift=-0cm]D) -- ([yshift=0.3cm]D);
      \draw[chain] ([yshift=0.3cm]C) edge[bend right=20] (D);
      %%%%% Plains
      \begin{scope}[opacity=.5,transparency group]
      \foreach \i in {0cm,0.3cm} {
          \draw[fill=gray,opacity=0.5] 
          ([yshift=\i]A) -- ([yshift=\i]B) --
          ([yshift=\i]C) -- ([yshift=\i]D) -- cycle ;
      }
      \end{scope}
      %%%%% Chains above
      \foreach \k in {A,B,C} {
      \draw[chain] ([yshift=-0cm]\k) -- ([yshift=0.3cm]\k);
      }
      \draw[chain] ([yshift=0.3cm]A) edge[bend left=20] (B);
      \draw[chain] ([yshift=0.3cm]B) edge[bend left=20] (C);
    \end{tikzpicture}%
        &
    \begin{tikzpicture}[every node/.style={scale=0.3},baseline]
    \begin{axis}[
       xmin=0,ymin=0.0, ybar, ybar, bar width=2pt,tiny,
       %ylabel={N, шт.},
       xlabel={угол, град},
       width=0.2\textwidth, height=2.5cm,]
       \addplot [no markers, raw gnuplot,fill=green!50!white]  table {%
        plots/acta/5.dist.twist};
     \end{axis}
    \end{tikzpicture}%
    \begin{tikzpicture}[every node/.style={scale=0.3},baseline]
    \begin{axis}[
       yticklabel pos=right,
       xmin=0,ymin=0.0, ybar, ybar, bar width=2pt,tiny,
       %ylabel={N, шт.}, 
       xlabel={планарность,\AA},
       width=0.2\textwidth, height=2.5cm,]
       \addplot [no markers, raw gnuplot,color=black,fill=red!50!white]  table {%
        plots/acta/5.dist.plane};
     \end{axis}
    \end{tikzpicture}%
       &
      \begin{tikzpicture}[every node/.style={scale=0.8},baseline]
  % TBA like
      \coordinate (A) at (0,0); 
      \coordinate (B) at (1.0,0);
      \coordinate (C) at (1.5,.5);
      \coordinate (D) at (.5,.5);
      \draw[chain] ([yshift=-0cm]D) -- ([yshift=0.3cm]D);
      \draw[chain] (C) edge[bend left=90, min distance=.5cm] (D);
      \begin{scope}[opacity=.5,transparency group]
      \foreach \i in {0cm,0.3cm} {
          \draw[fill=gray,opacity=0.5] 
          ([yshift=\i]A) -- ([yshift=\i]B) --
          ([yshift=\i]C) -- ([yshift=\i]D) -- cycle ;
  }
      \end{scope}
   \foreach \k in {A,B,C} {
      \draw[chain] ([yshift=-0cm]\k) -- ([yshift=0.3cm]\k);
  }
  \draw[chain] ([yshift=0.3cm]B) edge[out=90,in=90,min distance=.7cm] ([yshift=0.3cm]C);
  \draw[chain] (A) edge[bend right=90, min distance=.5cm] (B);
  \end{tikzpicture}%
  &
    \begin{tikzpicture}[every node/.style={scale=0.3},baseline]
    \begin{axis}[
       xmin=0,ymin=0.0, ybar, ybar, bar width=2pt,tiny,
       %ylabel={N, шт.},
       xlabel={угол, град},
       width=0.2\textwidth, height=2.5cm,]
       \addplot [no markers, raw gnuplot,fill=green!50!white]  table {%
        plots/acta/1.dist.twist};
     \end{axis}
    \end{tikzpicture}%
    \begin{tikzpicture}[every node/.style={scale=0.3},baseline]
    \begin{axis}[
       yticklabel pos=right,
       xmin=0,ymin=0.0, ybar, ybar, bar width=2pt,tiny,
       %ylabel={N, шт.}, 
       xlabel={планарность,\AA},
       width=0.2\textwidth, height=2.5cm,]
       \addplot [no markers, raw gnuplot,color=black,fill=red!50!white]  table {%
        plots/acta/1.dist.plane};
     \end{axis}
    \end{tikzpicture}%
\\

    \begin{tikzpicture} 
      % two propellers 
      \coordinate (A) at (0,0); 
      \coordinate (B) at (1.0,0);
      \coordinate (C) at (1.5,.5);
      \coordinate (D) at (.5,.5);
      %%%% chains below 
      \draw[chain] ([yshift=-0cm]D) -- ([yshift=0.3cm]D);
      %%%%% Plains
      \begin{scope}[opacity=.5,transparency group]
      \foreach \i in {0cm,0.3cm} {
          \draw[fill=gray,opacity=0.5] 
          ([yshift=\i]A) -- ([yshift=\i]B) --
          ([yshift=\i]C) -- ([yshift=\i]D) -- cycle ;
      }
      \end{scope}
      %%%%% Chains above
      \foreach \k in {A,B,C} {
      \draw[chain] ([yshift=-0cm]\k) -- ([yshift=0.3cm]\k);
      }
      \draw[chain] ([yshift=0.3cm]B) edge[bend left=20] (C);
      \draw[chain] ([yshift=0.3cm]A) edge[bend left=20] (D);
    \end{tikzpicture}%
          &
    \begin{tikzpicture}[every node/.style={scale=0.3},baseline]
    \begin{axis}[
       xmin=0,ymin=0.0, ybar, ybar, bar width=2pt,tiny,
       %ylabel={N, шт.},
       xlabel={угол, град},
       width=0.2\textwidth, height=2.5cm,]
       \addplot [no markers, raw gnuplot,fill=green!50!white]  table {%
        plots/acta/9.dist.twist};
     \end{axis}
    \end{tikzpicture}%
    \begin{tikzpicture}[every node/.style={scale=0.3},baseline]
    \begin{axis}[
       yticklabel pos=right,
       xmin=0,ymin=0.0, ybar, ybar, bar width=2pt,tiny,
       %ylabel={N, шт.}, 
       xlabel={планарность,\AA},
       width=0.2\textwidth, height=2.5cm,]
       \addplot [no markers, raw gnuplot,color=black,fill=red!50!white]  table {%
        plots/acta/9.dist.plane};
     \end{axis}
    \end{tikzpicture}%
          &%
    \begin{tikzpicture}
         % Two lateral 
      \coordinate (A) at (0,0); 
      \coordinate (B) at (1.0,0);
      \coordinate (C) at (1.5,.5);
      \coordinate (D) at (.5,.5);
      \draw[chain] ([yshift=-0cm]D) -- ([yshift=0.3cm]D);
      \draw[chain] (C) edge[bend left=90, min distance=.5cm] (D);
      \begin{scope}[opacity=.5,transparency group]
      \foreach \i in {0cm,0.3cm} {
          \draw[fill=gray,opacity=0.5] 
          ([yshift=\i]A) -- ([yshift=\i]B) --
          ([yshift=\i]C) -- ([yshift=\i]D) -- cycle ;
  }
      \end{scope}
   \foreach \k in {A,B,C} {
      \draw[chain] ([yshift=-0cm]\k) -- ([yshift=0.3cm]\k);
  }
  \draw[chain] (A) edge[bend right=90, min distance=.5cm] (B);
  \end{tikzpicture}%
  &
    \begin{tikzpicture}[every node/.style={scale=0.3},baseline]
    \begin{axis}[
       xmin=0,ymin=0.0, ybar, ybar, bar width=2pt,tiny,
       %ylabel={N, шт.},
       xlabel={угол, град},
       width=0.2\textwidth, height=2.5cm,]
       \addplot [no markers, raw gnuplot,fill=green!50!white]  table {%
        plots/acta/6.dist.twist};
     \end{axis}
    \end{tikzpicture}%
    \begin{tikzpicture}[every node/.style={scale=0.3},baseline]
    \begin{axis}[
       yticklabel pos=right,
       xmin=0,ymin=0.0, ybar, ybar, bar width=2pt,tiny,
       %ylabel={N, шт.}, 
       xlabel={планарность,\AA},
       width=0.2\textwidth, height=2.5cm,]
       \addplot [no markers, raw gnuplot,color=black,fill=red!50!white]  table {%
        plots/acta/6.dist.plane};
     \end{axis}
    \end{tikzpicture}%
  \\

    \begin{tikzpicture}
    % Basket like
      \coordinate (A) at (0,0); \coordinate (B) at (1.0,0);
      \coordinate (C) at (1.5,.5); \coordinate (D) at (.5,.5);
      \draw[chain] ([yshift=-0cm]D) -- ([yshift=0.3cm]D);
      \begin{scope}[opacity=.5,transparency group]
      \foreach \i in {0cm,0.3cm} {
          \draw[fill=gray,opacity=0.5] 
          ([yshift=\i]A) -- ([yshift=\i]B) --
          ([yshift=\i]C) -- ([yshift=\i]D) -- cycle ;
      }
      \end{scope}
     \foreach \k in {A,B,C} {
      \draw[chain] ([yshift=-0cm]\k) -- ([yshift=0.3cm]\k);
     }
     \draw[chain] (A) edge[bend right=70, min distance=.7cm] (C);
     \draw[chain] ([yshift=0.3cm]B) edge[in=90,out=90, min distance=.5cm]
     ([yshift=0.3cm]D);
    \end{tikzpicture}
    &
    \begin{tikzpicture}[every node/.style={scale=0.3},baseline]
    \begin{axis}[
       xmin=0,ymin=0.0, ybar, ybar, bar width=2pt,tiny,
       %ylabel={N, шт.},
       xlabel={угол, град},
       width=0.2\textwidth, height=2.5cm,]
       \addplot [no markers, raw gnuplot,fill=green!50!white]  table {%
        plots/acta/8.dist.twist};
     \end{axis}
    \end{tikzpicture}%
    \begin{tikzpicture}[every node/.style={scale=0.3},baseline]
    \begin{axis}[
       yticklabel pos=right,
       xmin=0,ymin=0.0, ybar, ybar, bar width=2pt,tiny,
       %ylabel={N, шт.}, 
       xlabel={планарность,\AA},
       width=0.2\textwidth, height=2.5cm,]
       \addplot [no markers, raw gnuplot,color=black,fill=red!50!white]  table {%
        plots/acta/8.dist.plane};
     \end{axis}
    \end{tikzpicture}%

    &
      \begin{tikzpicture}
  % TBA like with propeller
      \coordinate (A) at (0,0); 
      \coordinate (B) at (1.0,0);
      \coordinate (C) at (1.5,.5);
      \coordinate (D) at (.5,.5);
      \draw[chain] ([yshift=-0cm]D) -- ([yshift=0.3cm]D);
      \draw[chain] (C) edge[bend left=90, min distance=.5cm] (D);
      \begin{scope}[opacity=.5,transparency group]
      \foreach \i in {0cm,0.3cm} {
          \draw[fill=gray,opacity=0.5] 
          ([yshift=\i]A) -- ([yshift=\i]B) --
          ([yshift=\i]C) -- ([yshift=\i]D) -- cycle ;
      }
      \end{scope}
   \foreach \k in {A,B,C} {
      \draw[chain] ([yshift=-0cm]\k) -- ([yshift=0.3cm]\k);
     }
     \draw[chain] ([yshift=0.3cm]B) edge[out=90,in=90,min distance=.7cm] ([yshift=0.3cm]C);
      \draw[chain] ([yshift=0.3cm]A) edge[bend left=20] (B);
  \end{tikzpicture}%
  &
    \begin{tikzpicture}[every node/.style={scale=0.3},baseline]
    \begin{axis}[
       xmin=0,ymin=0.0, ybar, ybar, bar width=2pt,tiny,
       %ylabel={N, шт.},
       xlabel={угол, град},
       width=0.2\textwidth, height=2.5cm,]
       \addplot [no markers, raw gnuplot,fill=green!50!white]  table {%
        plots/acta/2.dist.twist};
     \end{axis}
    \end{tikzpicture}%
    \begin{tikzpicture}[every node/.style={scale=0.3},baseline]
    \begin{axis}[
       yticklabel pos=right,
       xmin=0,ymin=0.0, ybar, ybar, bar width=2pt,tiny,
       %ylabel={N, шт.}, 
       xlabel={планарность,\AA},
       width=0.2\textwidth, height=2.5cm,]
       \addplot [no markers, raw gnuplot,color=black,fill=red!50!white]  table {%
        plots/acta/2.dist.plane};
     \end{axis}
    \end{tikzpicture}%
\\
\end{tabular} 

prez.tex - основной файл (1.25 KB) Andrey Golovin, 02.10.2013 23:48

functions.tex - функции (523 Bytes) Andrey Golovin, 02.10.2013 23:48

packages.tex - пакеты (3.11 KB) Andrey Golovin, 02.10.2013 23:48

header.sty - настройка отображения (1.75 KB) Andrey Golovin, 02.10.2013 23:48

cont.tex (24.5 KB) Andrey Golovin, 02.10.2013 23:58

prez-2.png (5.74 KB) Andrey Golovin, 03.10.2013 00:22

nucl-6.png (4.54 KB) Andrey Golovin, 03.10.2013 00:32

nucl-5.png (5.2 KB) Andrey Golovin, 03.10.2013 00:33

prez-12.png (81.8 KB) Andrey Golovin, 03.10.2013 00:39

prez-11.png (5.33 KB) Andrey Golovin, 03.10.2013 00:42

table.png (8.18 KB) Andrey Golovin, 03.10.2013 00:48

prez-26.png (8.16 KB) Andrey Golovin, 03.10.2013 00:52

prez-20.png (20 KB) Andrey Golovin, 03.10.2013 01:01

prez-17.png (17.9 KB) Andrey Golovin, 03.10.2013 01:51