Wiki »
« Previous -
Version 4/10
(diff) -
Next » -
Current version
Andrey Golovin, 03.10.2013 00:23
Приёмы создания илюстраций в LATEX
Файлы и листинги которые я размещаю не идеальны, это рабочие файлы, которые делались часто на скорость.
Приамбула
В большинстве случаев я использую некий шаблон постоянного содержания откуда указывается путь к файлу с содержимым. Если надо задать некоторые функции я их выношу в отдельный файл, как впрочем настройки стилей, так и пакеты для использования.
Для сборки всего в один pdf файл используется:
lualatex --shell-escape prez.tex
Примеры
График функции и не только:
|_.Код |_. Результат |
|
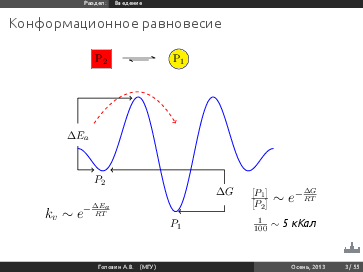
\begin{frame}%
{Конформационное равновесие}
  \begin{center}
    \schemestart
    \setnodestyle{draw,rectangle,fill=red,minimum size=20pt}
    \chemfig{P_2}
    \arrow{<->>}
    \setnodestyle{draw,circle,fill=yellow,minimum size=20pt}
    \chemfig{P_1}
    \schemestop
    \hspace{3cm}~\par
    \vspace{.75cm}
\begin{tikzpicture}[xscale=1.0,yscale=1.0]
    %% Pot energy plot
  \begin{axis}[height=7cm,width=15cm,
    xmin=-300,xmax=400,ymin=-.2, hide x axis, hide y axis,
    xlabel=$$, ylabel=$$]
   \addplot+[raw gnuplot, draw=blue, mark=none, smooth,thick] gnuplot[id=m]{%
         set xrange [-180:180]; plot 1-0.25*(1+cos(3*pi*x/180))- 0.25*(1+cos(2*pi*x/180)) };
  \draw[dashed,thick,red,->] (axis cs:-150,.7) parabola bend (axis cs:-70,0.95)(axis cs:0,.7);
  \addplot[->,thick] coordinates {(-180,0.33) (-150,0.33)};
  \addplot[->,thick] coordinates {(-180,0.90) (-80,.90)};
  \addplot[thick] coordinates {(-180,0.90) (-180,.70)};
  \addplot[thick] coordinates {(-180,0.33) (-180,.52)};
  \addplot[->,thick] coordinates {(90,0.33) (-120,0.33)};
  \addplot[->,thick] coordinates {(90,0.00) (5,.00)};
  \addplot[thick] coordinates {(90,0.33) (90,0.22)};
  \addplot[thick] coordinates {(90,0) (90,.05)};
  \node at (axis cs:-180,0.6) {$\Delta E_a$};
  \node at (axis cs:90,0.16) {$\Delta G$};
  \node at (axis cs:-140,0.25) {$P_2$};
  \node at (axis cs:0,-0.1) {$P_1$};
  \node at (axis cs:200,0.1){%
  \Large{$\frac{[P_1]}{[P_2]}\sim e^{-\frac{\Delta G}{RT}}
      $}
   } ;
  \node at (axis cs:200,-0.1){%
  $\frac{1}{100}\sim $ \textit{5 кКал}} ;
  \node at  (axis cs:-180,0){%
  \Large{$ k_v \sim e^{-\frac{\Delta E_a}{RT}}$}
  };
\end{axis}
\end{tikzpicture}
  \end{center}
\end{frame}%
<\code>
 | !prez-2.png! |

{{fnlist}}
prez.tex - основной файл
(1.25 KB)
Andrey Golovin, 02.10.2013 23:48
functions.tex - функции
(523 Bytes)
Andrey Golovin, 02.10.2013 23:48
packages.tex - пакеты
(3.11 KB)
Andrey Golovin, 02.10.2013 23:48
header.sty - настройка отображения
(1.75 KB)
Andrey Golovin, 02.10.2013 23:48
cont.tex
(24.5 KB)
Andrey Golovin, 02.10.2013 23:58
prez-2.png
(5.74 KB)
Andrey Golovin, 03.10.2013 00:22
nucl-6.png
(4.54 KB)
Andrey Golovin, 03.10.2013 00:32
nucl-5.png
(5.2 KB)
Andrey Golovin, 03.10.2013 00:33
prez-12.png
(81.8 KB)
Andrey Golovin, 03.10.2013 00:39
prez-11.png
(5.33 KB)
Andrey Golovin, 03.10.2013 00:42
table.png
(8.18 KB)
Andrey Golovin, 03.10.2013 00:48
prez-26.png
(8.16 KB)
Andrey Golovin, 03.10.2013 00:52
prez-20.png
(20 KB)
Andrey Golovin, 03.10.2013 01:01
prez-17.png
(17.9 KB)
Andrey Golovin, 03.10.2013 01:51